Personalizing inflation hits close to home
Continued high prices affect each household differently, challenging savings goals
Though the annual inflation rate has been consistently reported near 8%, it feels much higher to many consumers.
Why?
Because while the reported rate is for a standard “basket of goods,” our individual rate of inflation is instead influenced by our own household’s mix of purchases, frequency of consumption and the city we live in—among other factors. Calculating your household’s own inflation rate can help you budget for 2023, when high prices are expected to continue.
Spoiler alert: multiple metro areas in our footprint including Phoenix/Scottsdale, Dallas/Fort Worth and Houston were among the top six of 23 metro areas for inflation as high as 13%.
Those factors and others comprise what analysts call the Personal Inflation Rate (PIR). Using data and discipline, consumers can calculate their PIR relative to an average American household for key spending categories, or, as the dollar or percentage difference of household spend on those categories over time.
Three ways to calculate your PIR
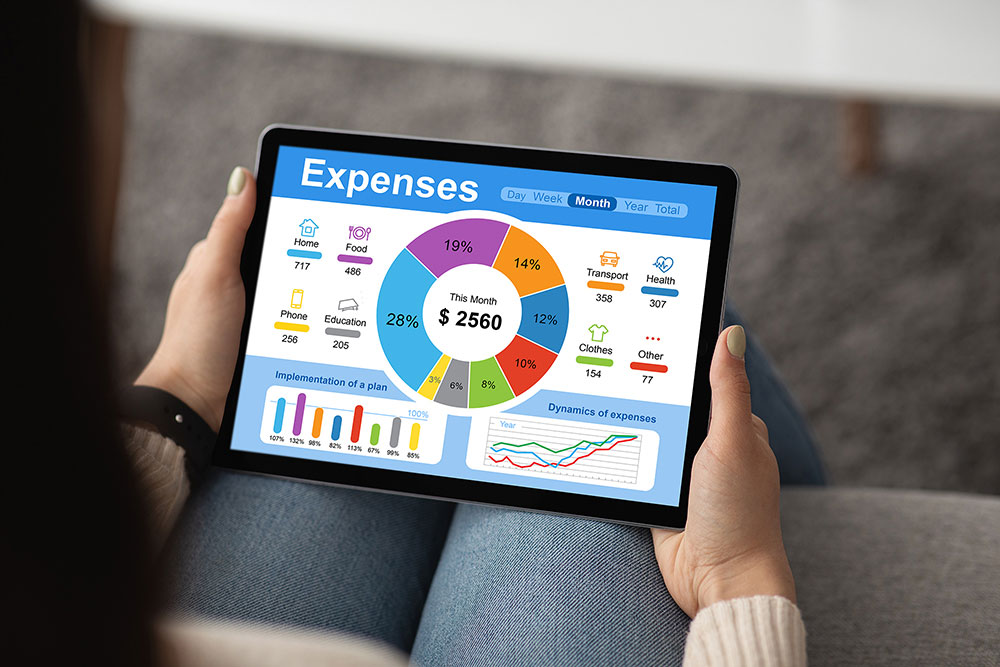
- Personal financial management programs like Quicken include budgeting tools and can deliver informative spending reports by week, month or year for expenses categorized as food, shelter, clothing, travel, etc.
- Online resources like Nerdwallet offer downloadable templates that include common income and spending categories.
- Many financial institutions offer similar tools with expenses pre-categorized or coded by industry or brand name.
She recommends tracking your spending to stay on budget and to know the differences between your assumed and actual spending. It’s not uncommon to find that our actual spending—aided by credit cards and transfers from savings—exceeds our assumed spending.

Key categories to track
During inflationary times, there’s no getting around spending more of your disposable income (wages minus taxes) on shelter, food, energy and transportation.
A close look at inflation numbers from the U.S. Bureau of Labor Statistics can support the “mine’s more than 8%” feeling.
- Food at home inflation, up 13% year-over-year through September 2022, belies the fact that prices for bakery, dairy, poultry and packaged or processed foods are up 15% - 30%. Anyone who’s recently paid $4 for a dozen eggs, $5 for a pound of butter or up to 73% more this year than last for a Thanksgiving turkey would likely agree. “Because many shoppers don’t buy a constant list each grocery store trip, the cumulative effect of the price increases may not be noticed until they total their monthly grocery spend,” said Bridges.
- Though rent is reported as 7% higher, many metros are reporting double-digit increases. The 10 highest cities for rent increases, led by Austin, Texas at 40%, are at least 29% higher year-over-year.
- Electricity, gasoline and natural gas prices have increased 15% - 35%, with home heating oil up 40%. While gasoline’s high early-year prices have fallen, the diesel fuel that helps move nearly everything near or far remains stubbornly expensive, 42% more than 2021.
- Prices for new vehicles averaged $47,000 through mid-2022. While used car prices are said to be moderating, many remain high, with the 13-year average auto age reflecting purchase price resistance and/or new auto shortfalls.
Personal inflation challenges savings goals
Rent increases and increasingly expensive credit card debt undermine saving for a home or retirement, said Bridges. Prospective homeowners are grappling with 7% mortgage rates, roughly twice those of a year ago. And, the paltry June 2022 3.0% personal savings rate, was among the smallest since 1959.
Bridges, located in Arizona, reports that rents are up 21% in Phoenix, raising the stated 8% U.S. inflation rate to 13% locally.
For a Phoenix household with $60,000 annual income and 30% budgeted for housing, that allotment rises to more than 36% when rent increases 21% without a corresponding income increase. Frustrated renters are left with less disposable income for other necessities and discretionary items like travel or recreation.
Lower-income and early career earners, whose baseline expenses absorb a proportionately high share of income are hurting the most, said Bridges. They’re affected by lagging wages plus the time and expense of commuting because many can’t work remotely or afford to live near their work. She cites Phoenix-area unleaded gas prices, up 33%, but wages up only 6.4%. Singles and single-income households where one earner carries the burden for expenses are similarly affected, as are those living on fixed incomes.
According to a recent Bankrate study, 55% of Americans surveyed said they were behind on their retirement savings, with inflation, reduced incomes and new expenses inhibiting their contributions.
“It’s sad that some young people can’t start saving for the long-term due to inflation,” said Bridges. “The early years of a career, when time is on your side, is the best time for dollar-cost-averaging those retirement plan contributions. And the decline in the markets this year has provided a great buying opportunity. Unfortunately, many are missing out because the dollars that should have gone to saving have instead gone to higher rent, gasoline and grocery prices.”
Many recent U.S. economic forecasts don’t indicate a quick reversal of fortunes. Some analysts believe that a recession is underway due to persistent inflation and rising inflation rates that are expected to continue, while others anticipate a five-year annual inflation rate of 2.5% - 3% as global supply chains improve and commodity prices fall.
None of us can individually reduce the Consumer Price Index announced monthly. But by knowing and assessing our individual or household PIR, we can factor it into our 2023 budgets and spending plans to better prepare for the uncertainty ahead.