Despite more multifamily housing, still too few homes
High shelter costs leading to ‘core’ inflation that’s nearly double Fed’s target
Despite a setback in the last inflation report, the overall trend in inflation is lower. As supply chains continue to heal, the inflation rate for goods is falling rapidly, and a mild winter keeps energy costs down. Yet despite areas where prices are deflating, like flat-screen TVs, the decline in the inflation rate merely means prices are rising more slowly, and the overall price level for consumers remains high.
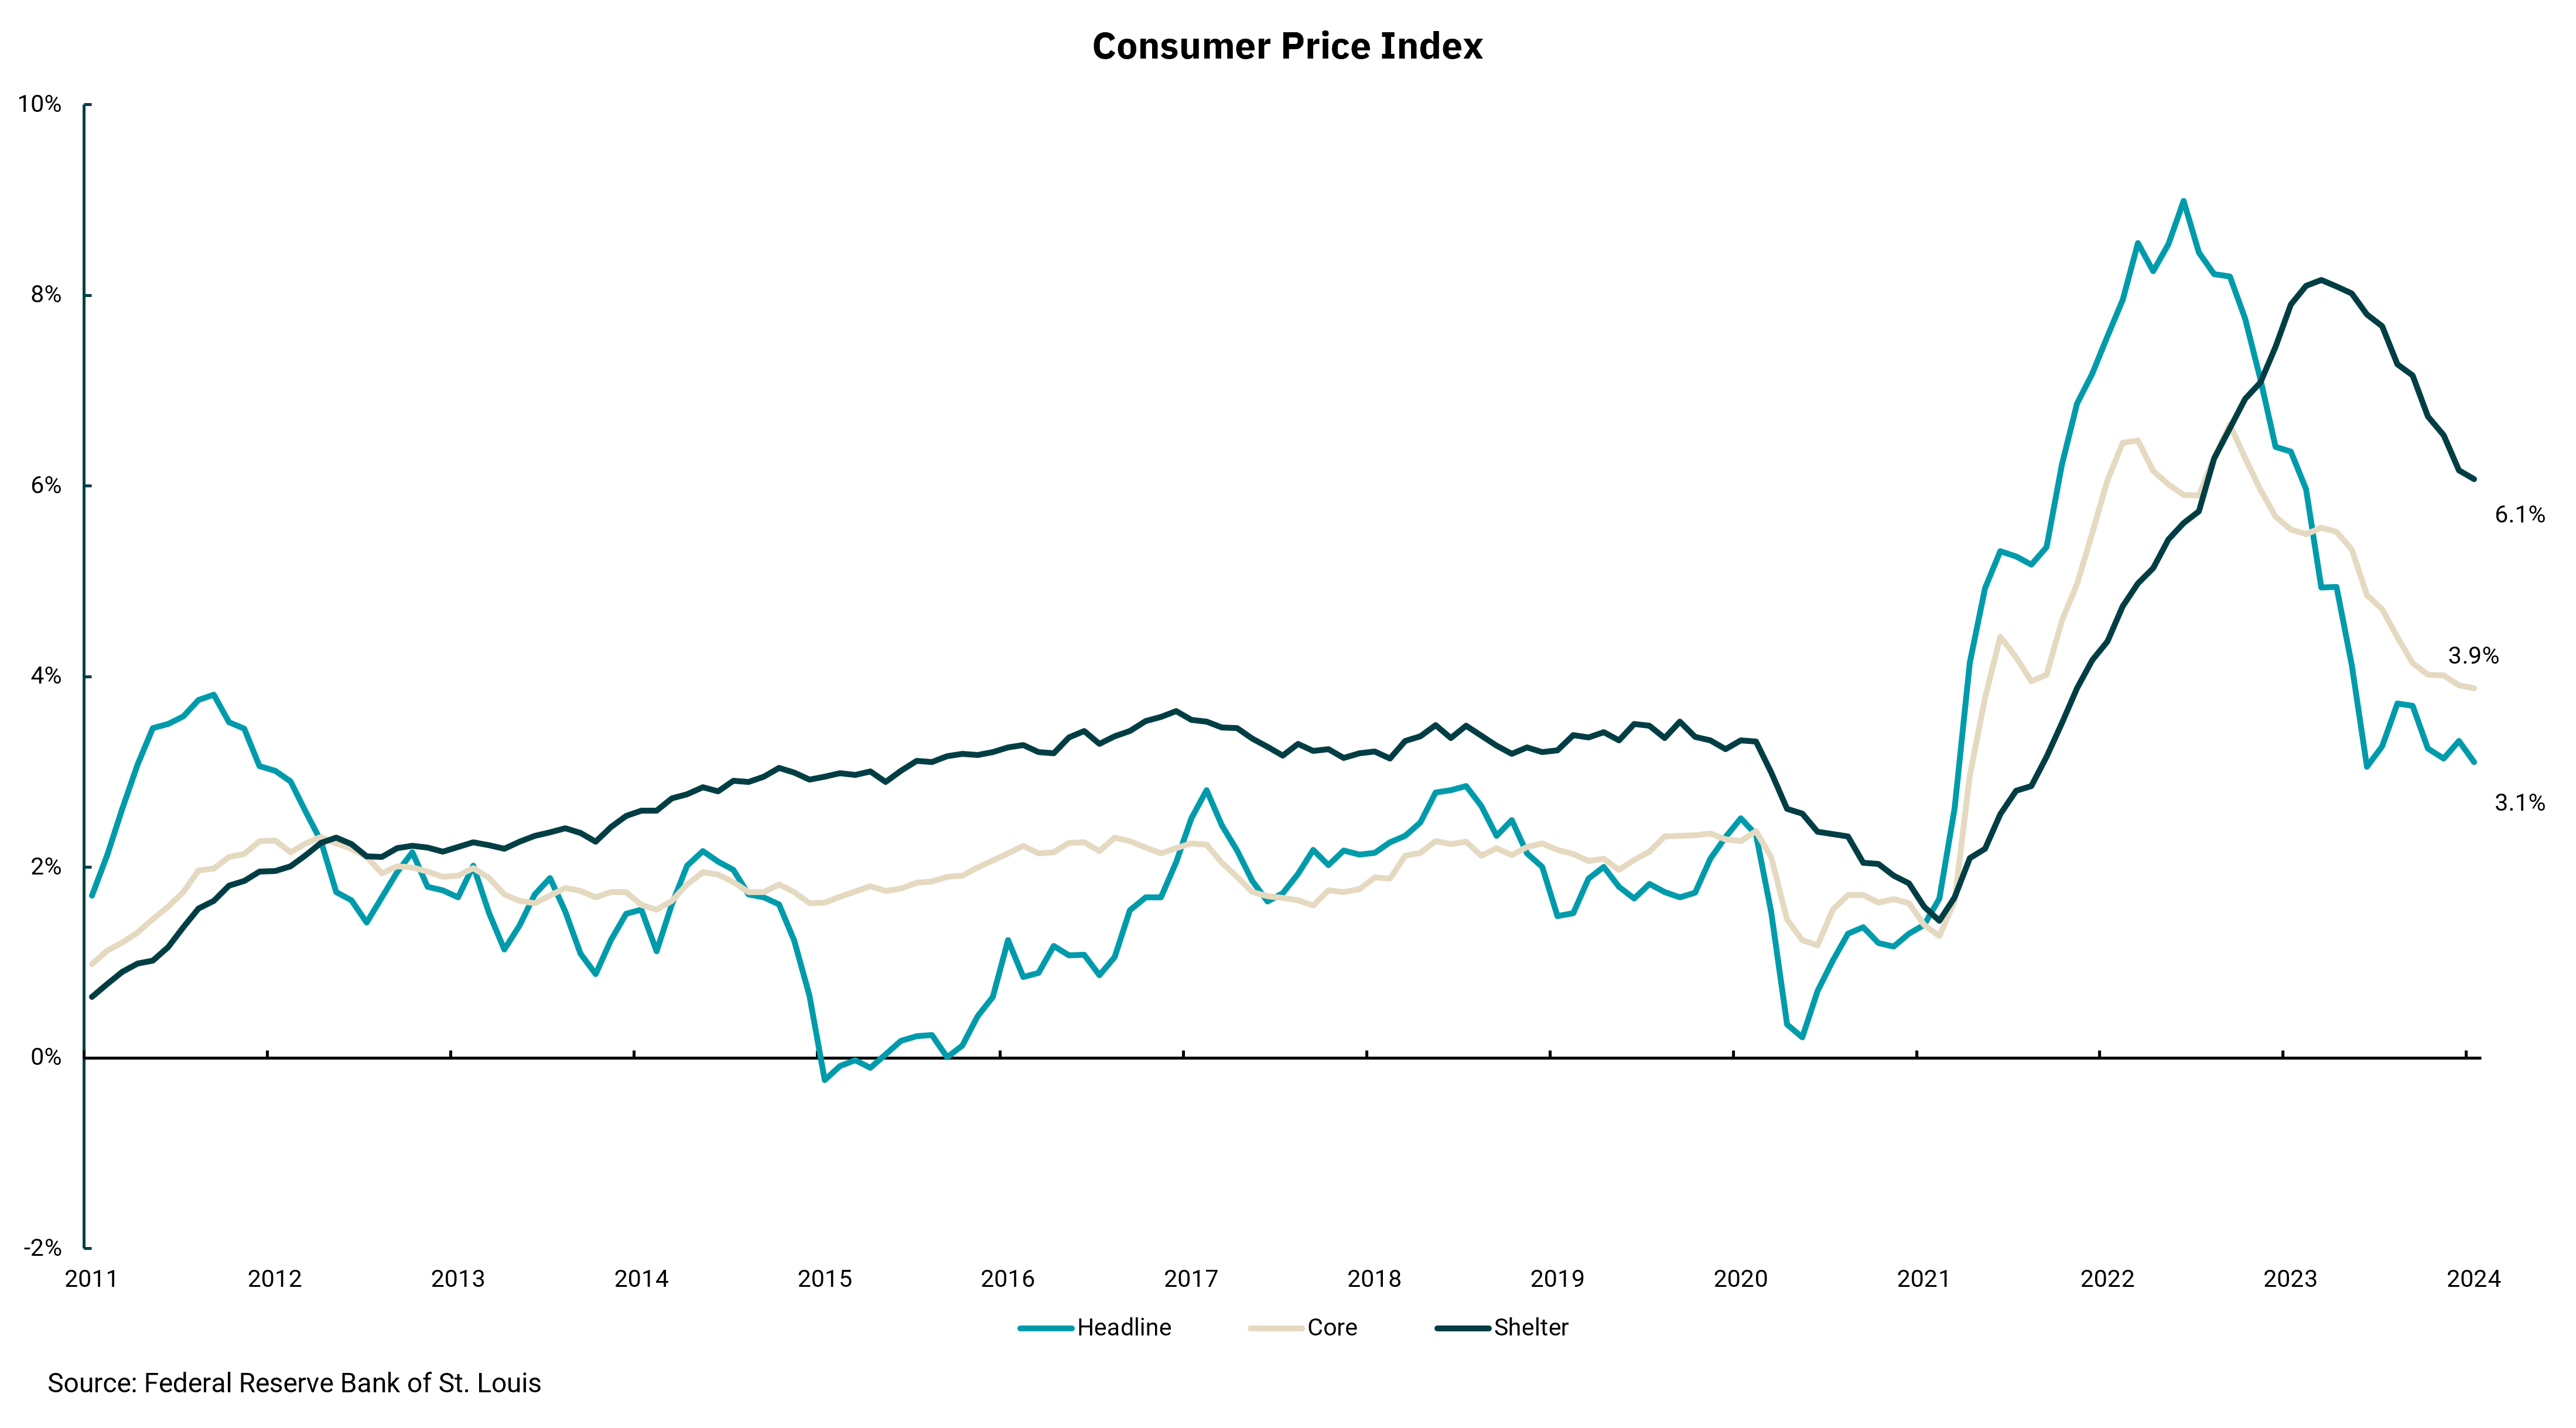
Moreover, the Federal Reserve pays more attention to the "core" rate of inflation, which at 3.9%, is still almost twice the Fed's 2% target. Recent comments by Fed governors have acknowledged the good news in the inflation trend but have expressed a need to see "more evidence" of inflation moving sustainably towards the 2% inflation target. We know wages are an important component of the Fed's views on longer-term inflation, yet wages are not directly measured within the Consumer Price Index (CPI) report. The biggest component impacting the core CPI rate is shelter costs. In this respect, there are two components to measuring shelter inflation: rents and owners' equivalent rents or OER.
This week's chart shows the shelter component of the CPI remaining well above the Fed's targets, responsible for pulling both the headline and core rates higher. However, the trend is lower in real-time data, like Zillow, where rents are declining in some regions. As single-family home sales have slowed, there has been a significant increase in the construction of multi-family rental units. This new supply, estimated at more than one million new units this year, should allow the downtrend in actual rents to continue. However, owners' equivalent rents (OER) are based on the survey of single-family homeowners and their estimate of what they would pay in rent, comparable to their cost of ownership. As such, OER tends to lag when inflation becomes more volatile. Homeowners' views on their home values and what corresponding rents might be tend to move in the general direction of inflation but at a slower pace.
In periods of rapid inflation, the core rate might move more slowly than the headline rate, as food and energy prices respond more quickly. This can be seen in the chart as the blue line moving above the beige line as inflation took off in 2021 and 2022. This also results in core inflation falling more slowly, as shown in the chart. The more volatile nature of the headline rate of inflation is a key reason why the Fed focuses on core readings. Still, in periods like this, where headline inflation is falling rapidly, it might seem the Fed is moving too slowly and keeping rates excessively high.
Our sense is the Fed will begin to lower rates as we move through spring toward summer. However, the firm housing market, where home values remain high, will mean OER will decline slower than actual rents, keeping the shelter component of CPI higher for longer. Unfortunately, the overall supply of single-family homes will not increase at levels to meet demand anytime soon. Multi-family housing is helping now, but looking longer term, the supply of new units is expected to decline as higher rates make new projects less viable.
Get By the Numbers delivered to your inbox.
Subscribe (Opens in a new tab)