

US consumers are still standing—but feeling the strain
Consumer debt and wage dynamics reveal a complex picture of financial resilience and vulnerability
6 min read
KEY POINTS
- Consumer spending drives nearly 70% of U.S. GDP, making financial health and job stability critical to economic growth.
- While total consumer debt is at record highs, debt service levels remain manageable, though the strain unevenly distributed across income groups.
- Wage growth has slowed for lower-income earners, contributing to rising delinquencies.
The health of the U.S. consumer is of the utmost importance as we think about future economic growth, as roughly 70% of U.S. gross domestic product (GDP) is based on consumer spending. The Federal Reserve recently shifted from focusing on inflation to focusing on signs of weakness in the labor market, which highlights the importance of consumers’ financial health. Whatever the environment, a consumer with a job and confidence in their employment situation is much more likely to spend than a consumer with little confidence or no job.
However, even having a job doesn’t mean everything is rosy. Past charts and commentary have pointed out the bifurcation of consumers based upon income quartiles, as well as the fact that inflation impacts people who don’t own financial assets, like a house and stocks, the hardest. With this in mind, our charts this week look at consumers from a couple of different perspectives, including their debt and earnings.
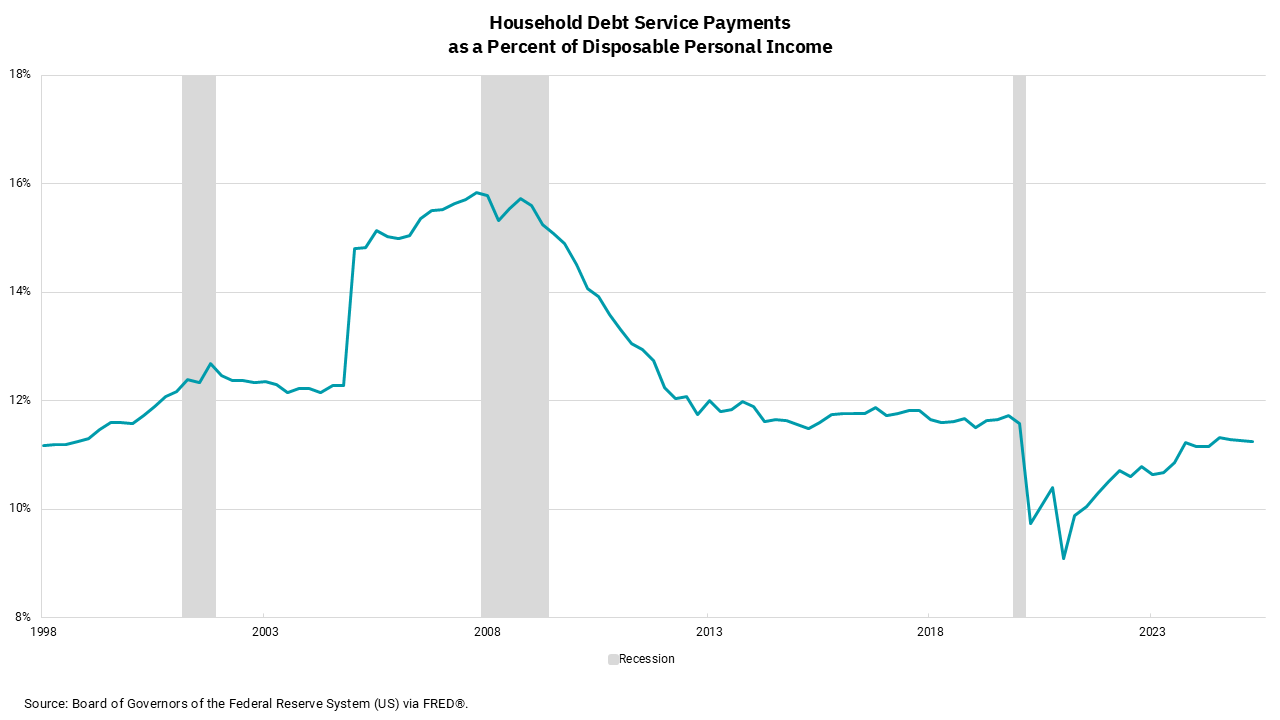
Total consumer debt levels—encompassing mortgages, student loans, auto loans and credit cards—are at record levels. That, in and of itself, is not bad, as we would expect that to be true within a growing economy. And growing it is: the gross output of the U.S. economy is at record levels. We also know it is not just the level of debt but the cost of that debt that matters. Our top chart tries to look at how the level and cost of overall consumer debt compares to past periods. What we see is a U.S. consumer that is in worse shape than they were after trillions of stimulus as we worked through the pandemic, but one that is still in better shape than when we went into the pandemic and materially better than the period leading up to and through the financial crisis. This is an overall picture, so we know within this data are consumers who are better off and worse off, but in aggregate, the U.S. consumer is okay from a debt service standpoint.
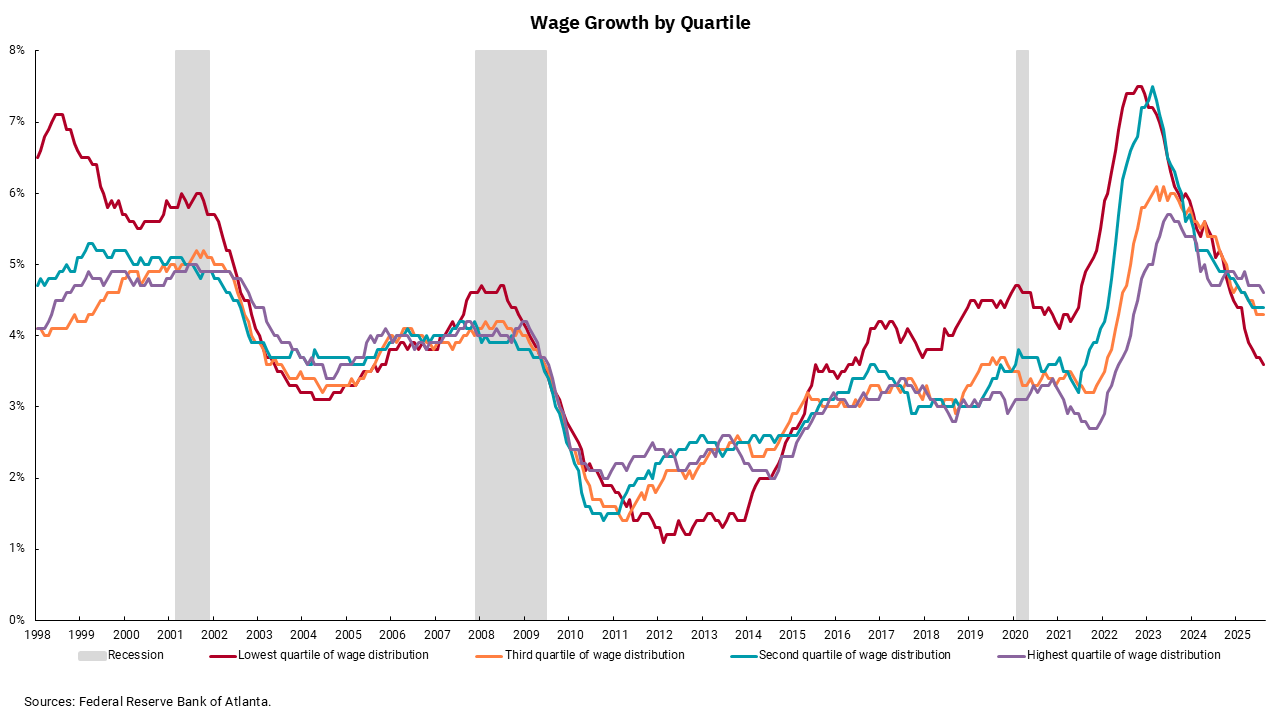
The bottom chart helps provide some clarity on the differing positions of the U.S. consumer. In this chart, we look at wage growth by income quartile. Coming out of the financial crisis and then through and out of the pandemic, we see a period where the lowest wage quintile was getting outsized wage gains compared to other income quintiles. That was particularly true as government stimulus plans were in effect, and we saw two open jobs for every unemployed person. You may not know this, but the federal minimum wage rate is still $7.25/hour. The “effective” minimum wage rate, however, is significantly higher than that.
Over the past couple of years, we have seen wage gains converge across income quintiles, and recently, lower income quintile wage gains have begun to lag. This helps explain why delinquencies by income and FICO score are rising faster for lower scores and income levels. I take from this data two things: First, it is still important for the Fed to work towards getting inflation back to their 2% target. Second, taking action to protect the job market is important, too. Unfortunately, doing both at the same time is difficult. For now, the focus of the Fed is the job market.
Get By the Numbers delivered to your inbox.
Subscribe (Opens in a new tab)