

Forget the noise, watch these two economic indicators instead
So far, the Iran conflict has not meaningfully changed expectations for growth
KEY POINTS
- Short term market swings often reflect noise, but credit spreads and jobless claims reveal how investors and businesses are actually responding.
- Low weekly jobless claims suggest companies remain confident enough to hold onto workers, supporting ongoing consumer spending.
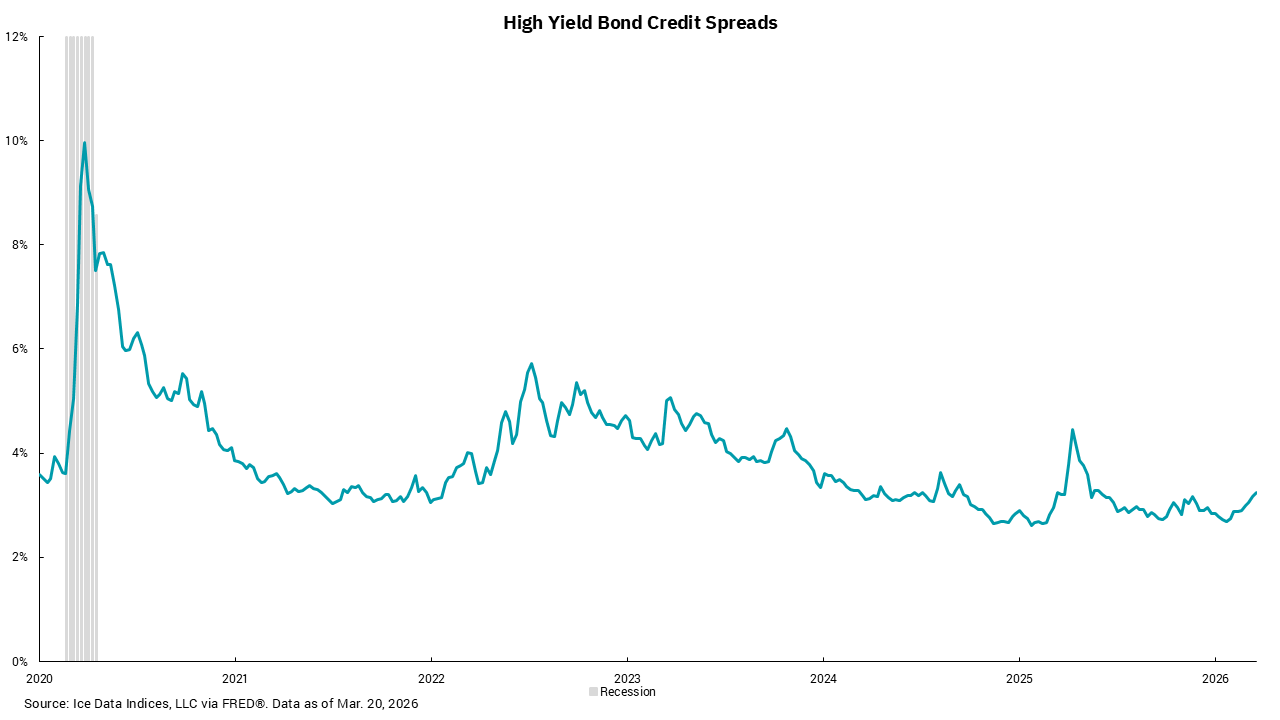
- Stable credit spreads indicate bond investors are not yet pricing in higher defaults or a meaningful economic slowdown.
Unexpected events can impact capital markets quickly. Stocks can rise or fall, and rates can move higher or lower. For longer-term investors, however, the short-term moves are less important than trying to discern when events might have a longer lasting impact. At what point do we need to rethink our outlook on economic growth, Federal Reserve policy or corporate earnings? This process can be difficult, as the volume of noise around the unexpected event can be very loud and opinions from all corners clamor for attention. During these periods, we find it useful to consider market and economic data points that show what investors are doing with their money and the actions companies might be taking. As always, there is what is said and then there is what is done. With all this in mind, we look at two of our favorite indicators in this week’s update— credit spreads and weekly jobless claims.
The U.S. economy is basically a three-legged stool, although not equally weighted. The U.S. consumer is responsible for the majority of economic activity—approximately two-thirds to 70%, as measured by gross domestic product (GDP). Business investment and government spending both make up about 17 to 18% of GDP. Now some of you might be saying, wait a minute, that could add up to over 100%—and you are correct. The last part of the GDP equation is trade. Since the U.S. routinely imports more than it exports, net trade often minuses from GDP. (The recent changes in trade policy are an attempt to change this.)
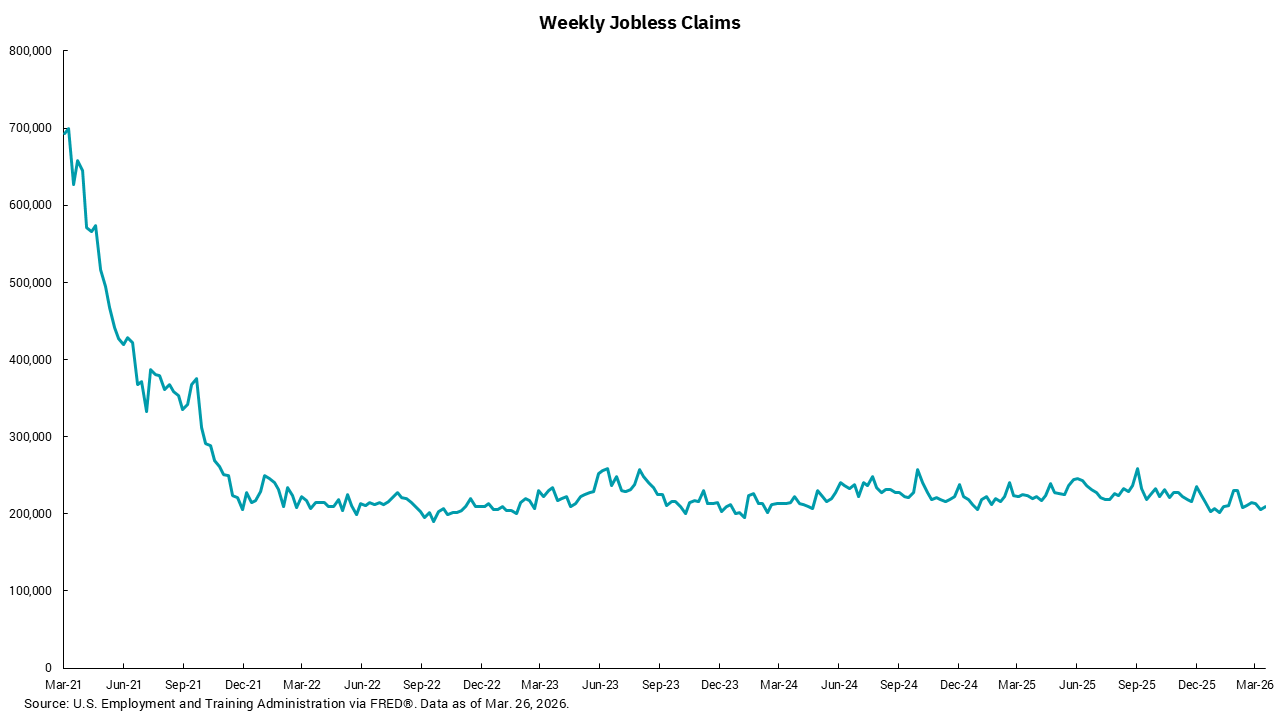
A look at government spending would show a consistent increase. We expect this to continue, so the more important aspect for us is what is happening in the private sector. Weekly jobless claims are a timely measure of what companies are doing in real time with payrolls. For U.S. consumers, having a job is the most important factor in considering future spending patterns. While we have seen hiring slow, weekly jobless claims show firing also remains low. Considering that the U.S. has a labor force of about 171 million, these numbers are really low.
We also watch credit spreads, as bond investors are keenly sensitive to the risk of losses from defaults. If the economy were expected to slow—and, with that, defaults were to increase—bond investors would demand a higher spread to compensate for additional risk. Hence, stable credit spreads indicate that, so far, bond investors are not anticipating higher defaults from a weakening economy. Of course, there are no hard-and-fast rules about when these indicators say trouble is ahead. However, an increase in weekly jobless claims above 260,000 to 300,000 would indicate companies are shedding workers. An increase in credit spreads above 6% would indicate a growing concern about future growth and corporate profitability. So far, the conflict in Iran has not triggered these moves.
The bottom line, however, is that while the conflict is not good for anyone, and we all hope for a quick resolution, the potential impacts might be less for the U.S. than the rest of the world.
Get By the Numbers delivered to your inbox.
Subscribe (Opens in a new tab)